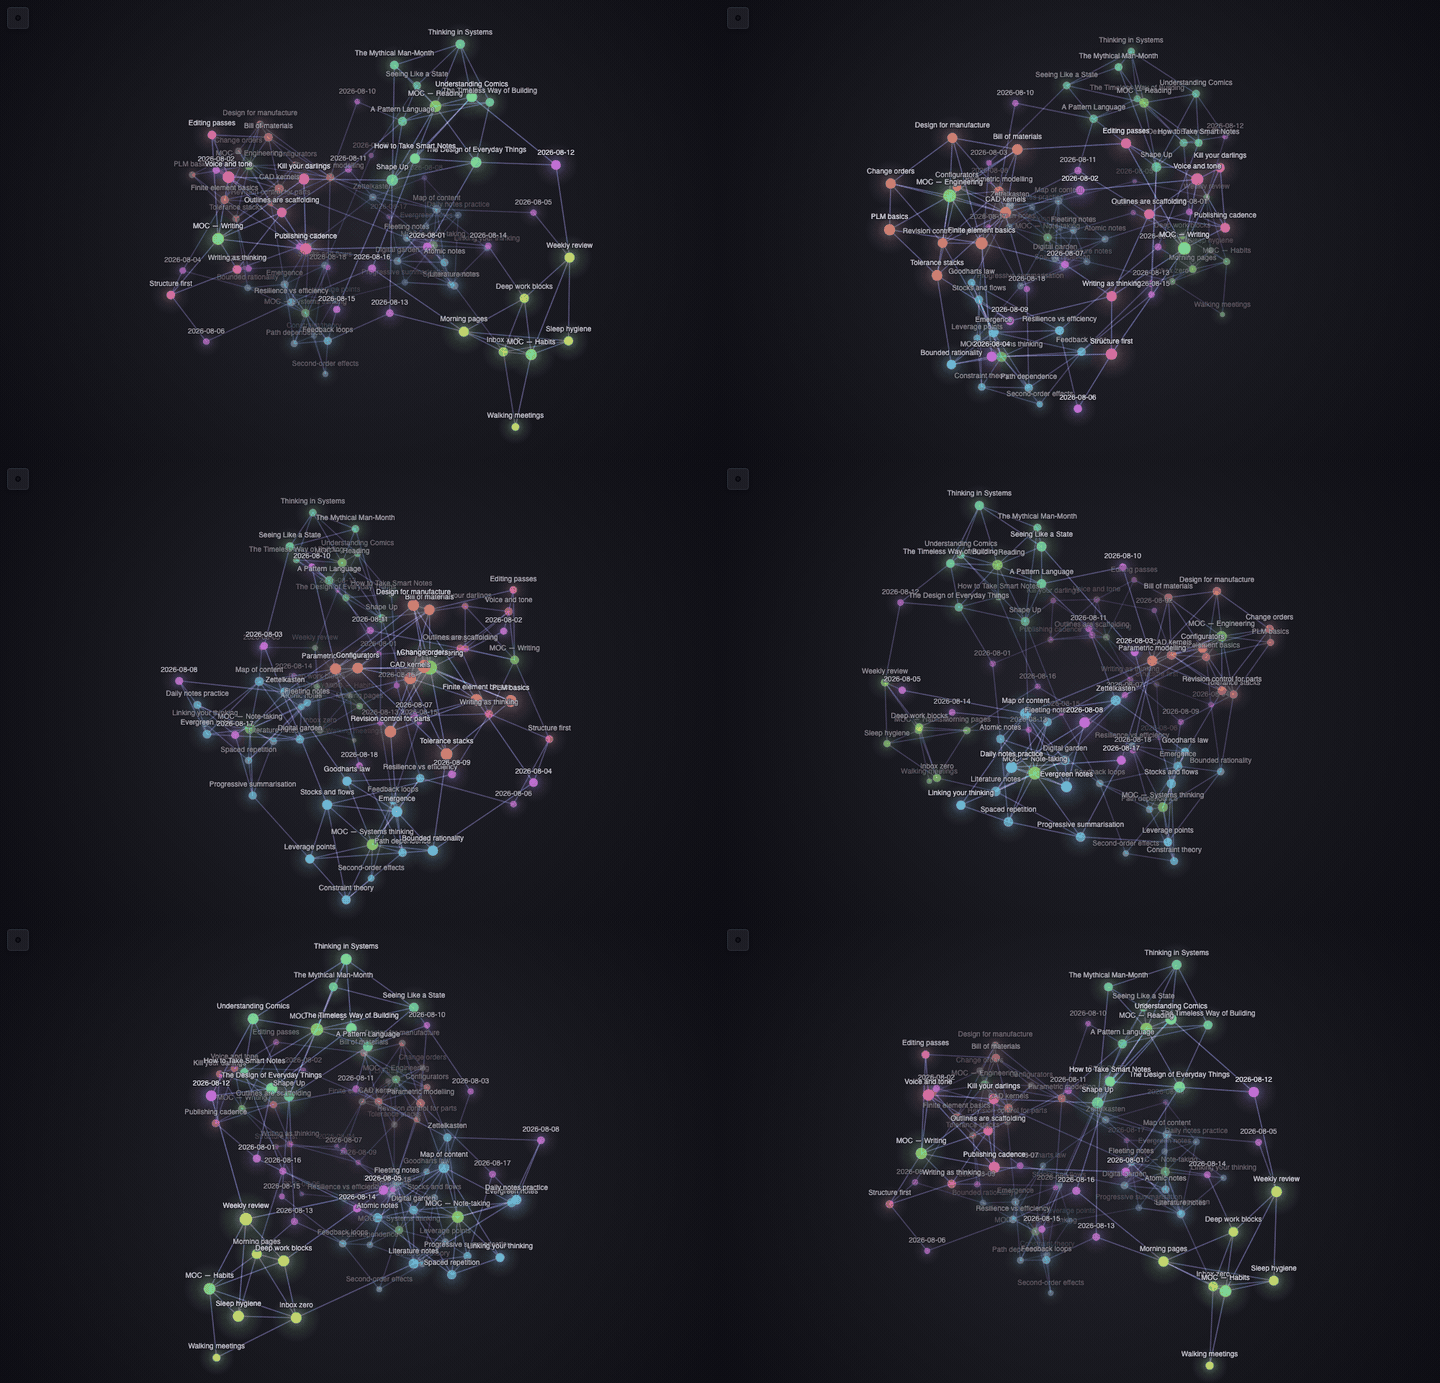
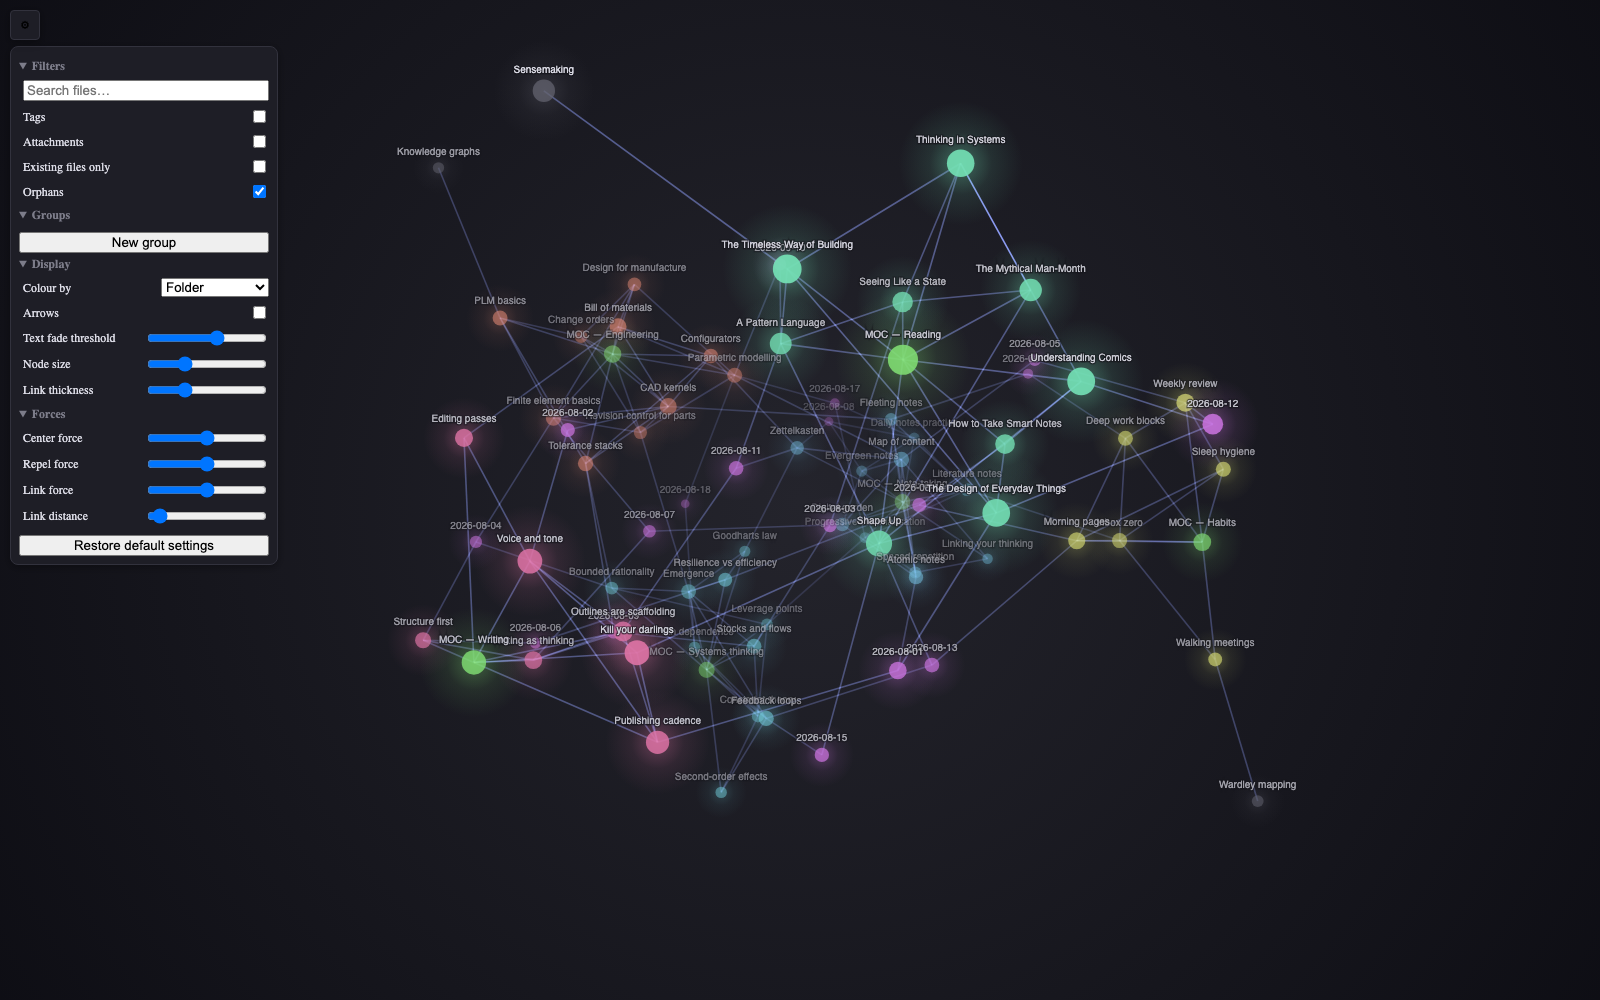
Armillary is a graph view for Obsidian with depth. It keeps the filters, groups and force sliders you already use in the built-in graph, and lets you orbit the thing. Free, MIT, and it has no dependencies at all.
The built-in graph is fine until a cluster gets busy. Then what you want is to look at it from a different angle, and you can't, because it's flat. Notes that have nothing to do with each other sit on top of one another and there's nothing you can do about it.
I did try the 3D plugins that already exist. They look good, but most of them quietly drop the controls I use every day: the search box, colour groups, the force sliders. So I wrote one that keeps the lot. If you know the graph settings panel, you already know this one.
It's about 700 lines of plain JavaScript. No three.js, no WebGL, no build step. It draws to an ordinary 2D canvas and does its own perspective maths, which was less work than it sounds and means it runs the same on a five-year-old laptop as on a new one. Nothing to download, nothing bundled.
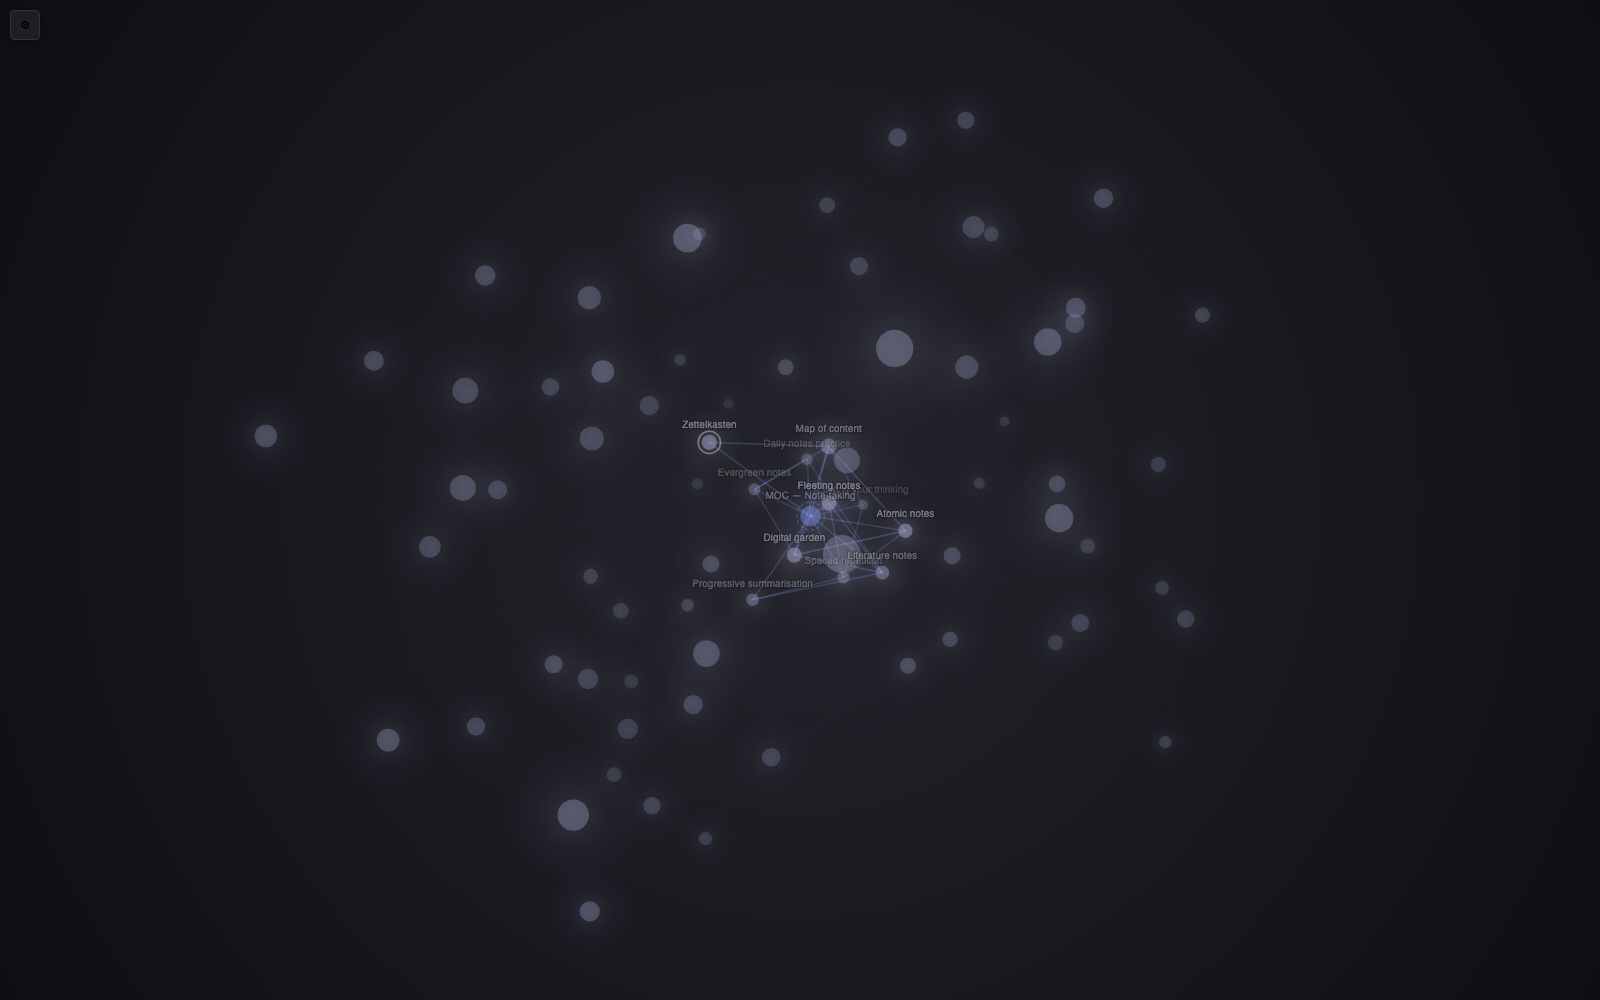
This is the bit I use most. Hover a note and everything it links to lights up, which the built-in graph does too. The problem is that the moment you move the mouse to rotate, it's gone.
So alt-click pins it. The highlight stays where it is and you're free to orbit around it, drag other notes out of the way, and see where that note actually sits in the vault. Click the empty space to let it go.
Groups work the way you'd expect: a query and a colour, as many as you want. But most of the time I don't want to write queries, I just want to see the shape of things. So there's a Colour by switch with three options: folder, tag, or number of links.
Folder is the one I leave on. Each folder takes a hue derived from its own name, so it keeps the same colour tomorrow, and your directory structure turns up in the graph without you doing anything.
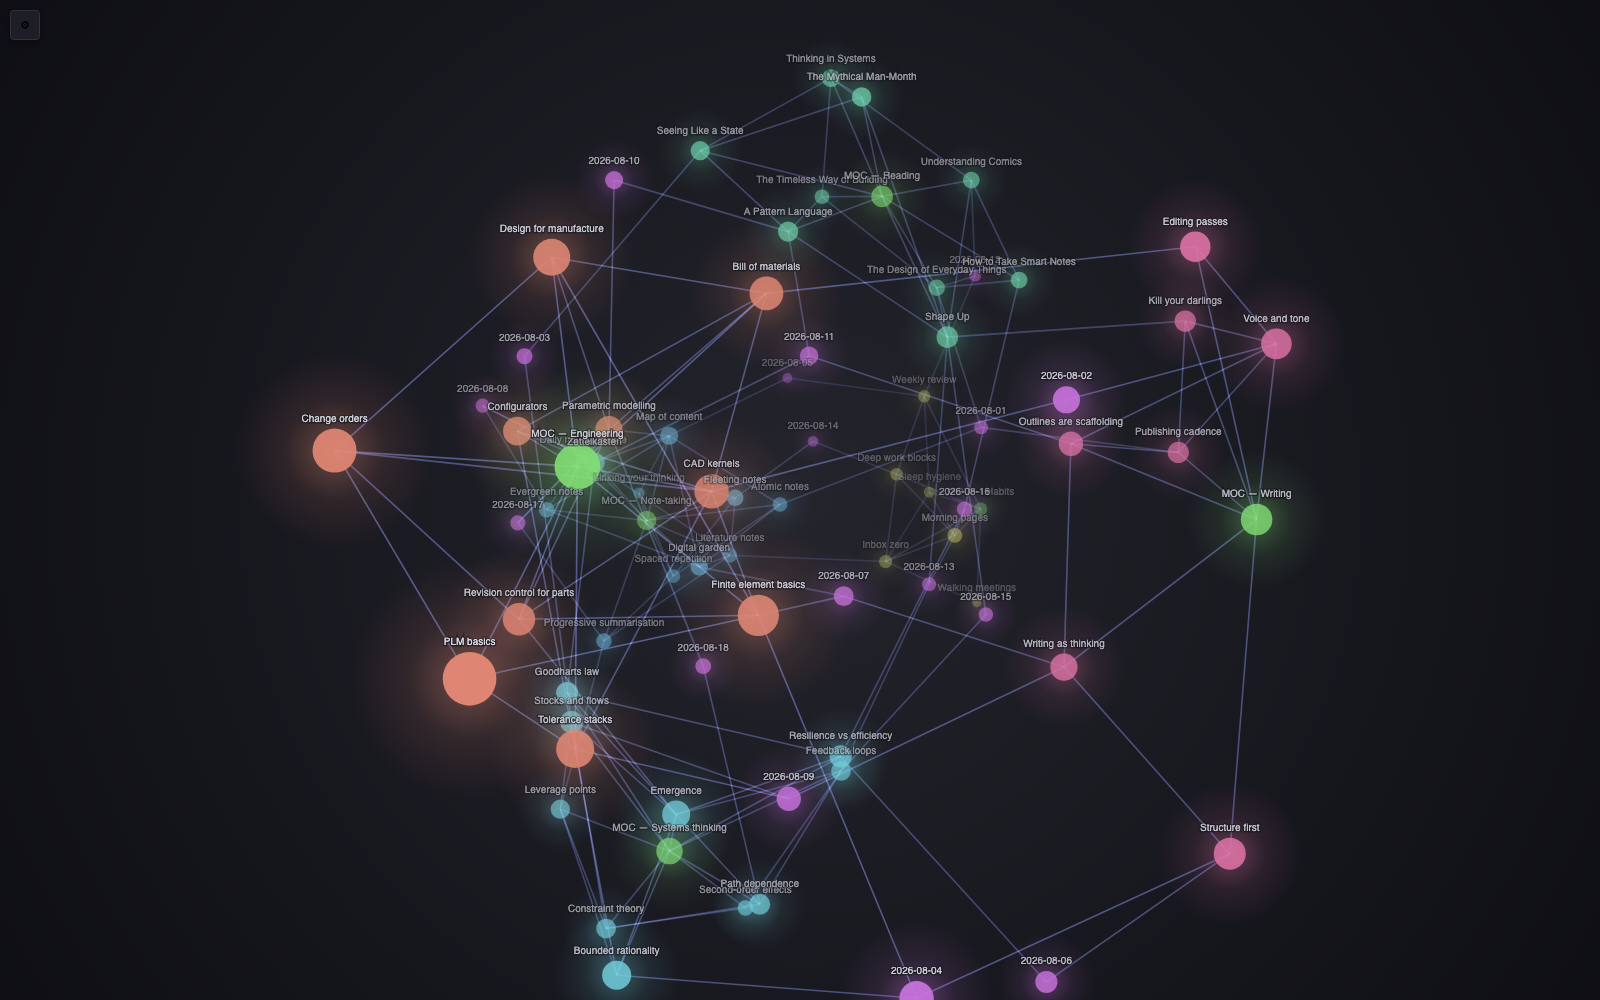
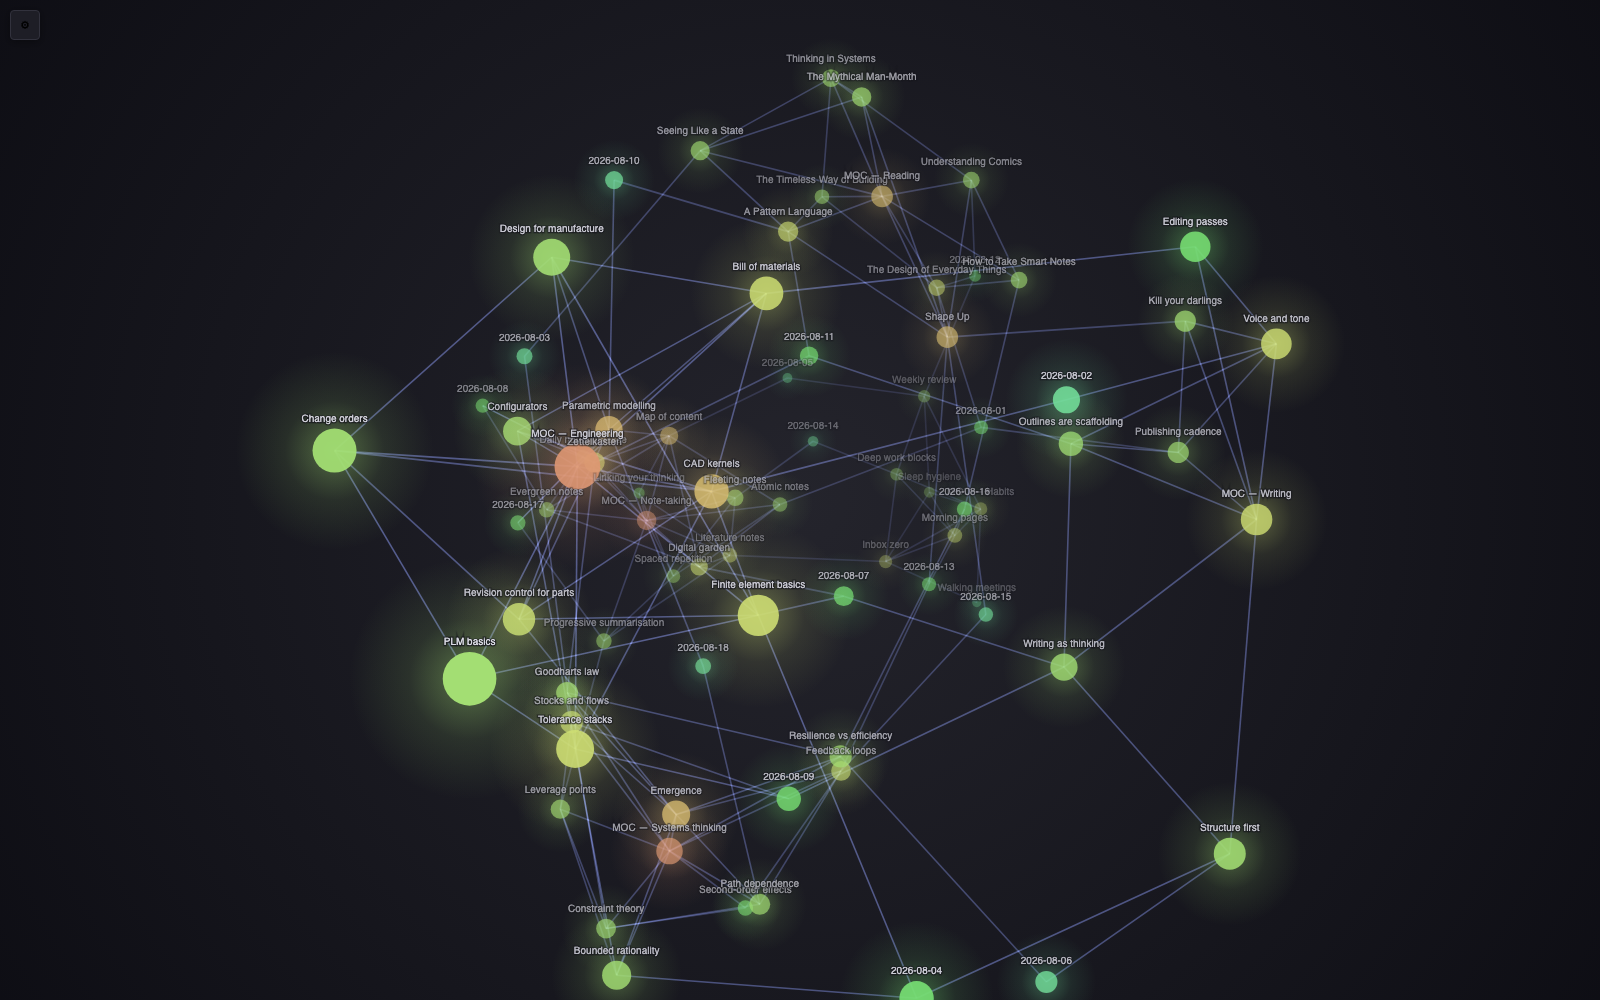
Left, coloured by folder. Right, by link count, which runs cold to warm so the hubs stand out.
Search, tags, attachments, existing files only, orphans, arrows, text fade threshold, node size, link thickness, and the four force sliders. Unresolved links show up as ghost nodes like they should. Node colours come from the same theme variables the built-in graph uses, so it sits properly in whatever theme you're running, light or dark.
| Drag | Orbit. It carries a bit of momentum, so you can fling it |
| Scroll | Zoom |
| Shift-drag, right-drag | Pan |
| Hover | Light up a note and everything it links to |
| Alt-click | Pin that highlight so you can orbit around it |
| Drag a node | Move it. It stays where you drop it |
| Click | Open the note. Ctrl or Cmd for a new tab |
| Ctrl-hover | The usual page preview popover |
| Double-click | Reset the view and unpin everything |
Worth knowing before you install it:
path:, file:, tag:, minus signs
and quoted phrases work, and nothing cleverer than that.It's waiting on review for the community plugin browser. Until it lands there, grab the three files from the release and drop them in yourself:
cd <your vault>/.obsidian/plugins
mkdir armillary
# put main.js, manifest.json and styles.css in there
Then turn it on in Settings, Community plugins. Open it from the ribbon icon on the left, or the command palette, Open 3D graph view.